Thursday, November 29, 2012

How cheap are stocks? (Two views)

In the current low-yield environment, money has been piling into the income investment theme by driving down the yields on anything that has a yield. In particular, dividend paying stocks have been a major beneficiary of this trend. Recently, Morgan Stanley highlighted how far this investment mania has run in their 2013 investment outlook document by pointing out the earnings yield on stocks is now higher than high-yield bonds (via Business Insider).


Stocks are cheap and junk bonds are expensive. Right?

My view is that. on a relative valuation basis, that view is correct. Stocks are cheap compared to high-yield bonds, but they aren't screamingly cheap on an absolute basis. Consider this chart of the market cap to GDP ratio (via VectorGrader), which is a proxy for the Price to Sales ratio. (A related ratio, namely the market cap to GNP, is one of Warren Buffett's favorite valuation metrics.) Note how the ratio, shown on the top panel, is falling and still hasn't gotten back to its long term average and it is nowhere near levels where secular bull markets tend to begin. As well, falling market cap to GDP eras tend to be associated with secular bear markets, where stock prices (bottom panel) tend to be range-bound.


These conditions suggest that the income theme is overdone, but stocks aren't terribly cheap. Investors should adjust their return expectations accordingly.


Cam Hui is a portfolio manager at Qwest Investment Fund Management Ltd. ("Qwest"). This article is prepared by Mr. Hui as an outside business activity. As such, Qwest does not review or approve materials presented herein. The opinions and any recommendations expressed in this blog are those of the author and do not reflect the opinions or recommendations of Qwest.


None of the information or opinions expressed in this blog constitutes a solicitation for the purchase or sale of any security or other instrument. Nothing in this article constitutes investment advice and any recommendations that may be contained herein have not been based upon a consideration of the investment objectives, financial situation or particular needs of any specific recipient. Any purchase or sale activity in any securities or other instrument should be based upon your own analysis and conclusions. Past performance is not indicative of future results. Either Qwest or Mr. Hui may hold or control long or short positions in the securities or instruments mentioned.


Monday, November 26, 2012

Risk on!

Last Monday I speculated that equities were on the verge of a Santa Claus rally (see Waiting for a Santa Claus rally) and what a rally we've had in the week!

Since then, the news backdrop has turned more positive. Mark Hulbert reported that insiders are buying again, which is a signal of a sustainable intermediate term upswing in stock prices. China's PMI has moved into expansion mode and Pragmatic Capitalism noted that China’s leading indicators continue to improve and Nomura is turning more bullish on the Chinese economy (China bulls may be interested in my post A better way to play a China rebound).


One of the key indicators I said to watch is the stochastic on the NYSE Summation Index:
I have been watching the slow stochastic of the NYSE Summation Index, which is shown below in the top panel, with the SPX shown in the bottom panel. In the past, cross-overs in the stochastic have marked good entry points to get long the stock market and this indicator has only failed once out of six in the past two years.
As the chart below shows, we have seen the crossed over in the stochastic and, if history is any guide, this market should be good for a rally of 4-6 weeks. This pattern is consistent with a Santa Claus rally lasting until year-end.


Nearby resistance a sign of pause?
What could possibly go wrong?

In the short term, the market is approaching overbought territory. As well, I see numerous signs that major indices are approaching resistance levels, either minor or major, which could cause the market to pause and consolidate its gains for one or two weeks. For instance, take the chart of the SPX below and note how it's in a uptrend but approaching a nearby resistance zone, marked in yellow.


The SPY/TLT ratio, which measures the relative returns of equities against long Treasury bonds as a proxy for the risk-on/risk-off trade, is also nearing an overhead relative resistance level.


This pattern of risky assets rallying and nearing technical resistance levels is not just confined to the United States. Across the Atlantic, the Euro STOXX 50 will bump its head against technical resistance should it rise much further.


Hong Kong's Hang Seng Index is in an ascending triangle and likely to test resistance soon.  
I could go on, but you get the idea. Given the proximity of nearby overhead resistance, the most likely scenario is for stocks to fail the first time it tests those levels. We will then see some sort of pullback and consolidation period for one to two weeks.  

Bottom line: The bulls have seized the initiative and markets are likely to continue their rally, but may pull back and consolidate their gains in the next 1-2 weeks. Traders may wish to view any weakness as opportunities to add to their positions.        


Cam Hui is a portfolio manager at Qwest Investment Fund Management Ltd. ("Qwest"). This article is prepared by Mr. Hui as an outside business activity. As such, Qwest does not review or approve materials presented herein. The opinions and any recommendations expressed in this blog are those of the author and do not reflect the opinions or recommendations of Qwest.  

None of the information or opinions expressed in this blog constitutes a solicitation for the purchase or sale of any security or other instrument. Nothing in this article constitutes investment advice and any recommendations that may be contained herein have not been based upon a consideration of the investment objectives, financial situation or particular needs of any specific recipient. Any purchase or sale activity in any securities or other instrument should be based upon your own analysis and conclusions. Past performance is not indicative of future results. Either Qwest or Mr. Hui may hold or control long or short positions in the securities or instruments mentioned.
 

Sunday, November 25, 2012

Europe dodges another bullet (Not the Catalan election)

I have written in the past about how tail risk is diminishing in the eurozone. Another recent event occurred which further racheted down the probability of another black swan event.

No, it wasn't the results of the Catalan election, where the ruling secessionist CiU underperformed expectations that it would get between 60 and 64 seats (via FT Alphaville). Instead, it appears to have won a measly 50 seats, with the left wing separatist ERC in second place with 21 seats. Together they could form a majority that could call for a referendum. However, Masa Serdarevic of FT Alphaville noted:
It’s also important to notice that the independent parties together are instead expected to obtain a clear majority. United, they could thus still approve a motion calling a referendum on independence. It would however be a completely unusual coalition centred on the conservative CiU and the leftist ERC.

The Russian Black Sea Fleet in Athens?
No, the wild card that I had been watching for is for Greece to turn to Russia instead of the Troika for financing. What if the Greeks got tired of the pain and turned to Putin for relief? Moscow has long had a historical desires for the warm waters of the Mediterranean for centuries. A financing deal could have shook up NATO and significantly shifted the geopolitical balance in the Eastern Med.

The test case was Cyprus. Russian nationals have a large presence on that island. As its banks got into trouble because they were stuffed full of Greek debt, the Cyprus economy was in peril. As the New York Times reported in June:
The Russian government last year gave Cyprus a three-year loan of 2.5 billion euros, or $3.1 billion at the current exchange rate, at a below-market rate of 4.5 percent to help it service its debt. Cyprus now needs at least 1.8 billion euros, or $2.3 billion, by the end of this month to buttress its ailing banking sector.
Instead of turning to the EU, they turned to Russia [emphasis added]:
Now many on this tiny island nation, whose banks and government are facing economic insolvency, are hoping for financial salvation from Russia rather than Germany and the European Union.

“I would much rather be saved by Moscow,” said Elena Tsolia, 30, an attendant at the department store Debenhams, where Russian shoppers snap up bottles of Dior and Chanel perfume. “We are a small island and we don’t want to be owned by Germany.”
It didn't hurt that Noble Energy announced a large gas field discovery in Cyprus waters [emphasis added]:
Noble Energy Inc. said a field off the coast of Cyprus may hold as much as 8 trillion cubic feet of natural gas, the first discovery off the divided island nation.

Results from the Cyprus A-1 well indicate from 5 to 8 trillion cubic feet of gas, with a gross mean of 7 trillion cubic feet, Houston-based Noble Energy said today in a statement. The field covers about 40 square miles (100 square kilometers) and requires additional appraisal drilling before development, the company said.

The gas discovery in the exclusive economic zone of our country creates great prospects for Cyprus and its people, which we shall seriously, prudently and collectively exploit to serve public interest,” Cypriot President Demetris Christofias said at a press conference in Nicosia today. “Cyprus is coming into Europe’s energy map with prospects of substantially contributing to the EU’s energy security.”
Cyprus would have been the test case of Russia flexing its financial and geopolitical muscle in the Eastern Med.

Today Nicosia, tomorrow Athens? Can you say "Russian Black Sea fleet base in Athens, or Crete"?


On Friday, a little noticed announcement came across my desk. The headline was CYPRUS Government - Troika reach agreement:
The Government of the Republic of Cyprus informed on the 25th of June 2012 the appropriate European Authorities of its decision to submit to euro area Member States a request of financial assistance from the EFSF/ESM.

This agreement has closed the door to a Russian financial rescue of Athens - and the ultimate black swan event of 2013. Tail risk in Europe just fell some more.

 
Cam Hui is a portfolio manager at Qwest Investment Fund Management Ltd. ("Qwest"). This article is prepared by Mr. Hui as an outside business activity. As such, Qwest does not review or approve materials presented herein. The opinions and any recommendations expressed in this blog are those of the author and do not reflect the opinions or recommendations of Qwest.

None of the information or opinions expressed in this blog constitutes a solicitation for the purchase or sale of any security or other instrument. Nothing in this article constitutes investment advice and any recommendations that may be contained herein have not been based upon a consideration of the investment objectives, financial situation or particular needs of any specific recipient. Any purchase or sale activity in any securities or other instrument should be based upon your own analysis and conclusions. Past performance is not indicative of future results. Either Qwest or Mr. Hui may hold or control long or short positions in the securities or instruments mentioned.

Thursday, November 22, 2012

How to tell when the commodity supercycle is over

Further to my last post (see Why China won't cause a commodity crash (yet)), I got a number of questions of what indicators I watch beside the Vancouver residential property market to see when the commodity supercycle is over.

Chart of the Day latest chart showed a graph of the Dow/gold ratio. Watch for a reversal of that trend - then you'll know that paper is triumphant over hard assets (commodities).


Cam Hui is a portfolio manager at Qwest Investment Fund Management Ltd. ("Qwest"). This article is prepared by Mr. Hui as an outside business activity. As such, Qwest does not review or approve materials presented herein. The opinions and any recommendations expressed in this blog are those of the author and do not reflect the opinions or recommendations of Qwest.

None of the information or opinions expressed in this blog constitutes a solicitation for the purchase or sale of any security or other instrument. Nothing in this article constitutes investment advice and any recommendations that may be contained herein have not been based upon a consideration of the investment objectives, financial situation or particular needs of any specific recipient. Any purchase or sale activity in any securities or other instrument should be based upon your own analysis and conclusions. Past performance is not indicative of future results. Either Qwest or Mr. Hui may hold or control long or short positions in the securities or instruments mentioned.

Wednesday, November 21, 2012

Why China won't cause a commodity crash (yet)

Edward Morse at Citi (via Business Insider) has made a bearish call on the commodity supercycle based on a slowing Chinese economy and re-balancing growth away from infrastructure spending toward the consumer.


I beg to differ. The secular commodity bull cycle is not ending this cycle, but in the next downturn.


More of the same-old-same-old?
That's because the new leadership are not reformers and these "princelings" are showing little inclination to re-balance growth away from SOEs and big ticket projects, where many of the elites made their money, toward the household sector, which would benefit the Chinese economy longer term but would gore the CCP cadres' ox. Here is a typical view (out of many) from Forbes [emphasis added]:
At least four—and maybe as many as six—of the new Politburo Standing Committee are so-called “conservatives.” In the Chinese context, this means they are not predisposed to stopping the backward drift evident in Beijing since the middle of 2006. Then, Hu Jintao began to undo the legacy of Deng Xiaoping, whose transformational policies were encapsulated by the phrase “reform and opening up.”


Hu’s policy of closing the country down was popular inside Beijing for many reasons, but it became China’s new paradigm because it had the support of what David Shambaugh calls the “Iron Quadrangle,” state-owned enterprises, the security apparatus, the People’s Liberation Army, and Communist Party conservatives. “The coalition of these four power interest groups ‘captured’ Hu, who was too weak and disinclined to stand up to them, and they stalled reforms,” writes the noted George Washington University professor. Others define the constituent elements of the conservatives differently—many identify “powerful families” as being inside this circle of power, for instance—but it’s clear that entrenched interests now dominate politics in the Chinese capital.
The Forbes analysis went on about the conservative bent of the new leadership:
Apart from Li [i.e. Li Keqiang, the new premier], the Standing Committee looks reactionary. The No. 3 leader is a North Korea-trained economist, Zhang Dejiang. Zhang will almost certainly represent the interests of state enterprises in future deliberations. The member slated to get the economics portfolio is the last-ranked Zhang Gaoli, another defender of vested interests. He is expected to block any reform initiatives that Li Keqiang may hatch.

Corruption becoming a legitimacy issue for the government
I wrote about this before (see China beyond the hard/soft landing debate). China has become, in the words of John Hempton, a kleptocracy. The boom was maintained through the financial repression of the household sector and the composition of the latest Poliburo suggests that financial repression, which has enriched many Party insiders, will continue.

The obscene wealth accumulated by the princelings and other officials, i.e. corruption, is becoming a problem of legitimacy in China. Michael Spence wrote about how Singapore, which is another country governed by a single party, could be a role model for China: [emphasis added]
Like Singapore, Japan, South Korea, and Taiwan in their first few decades of modern growth, China has been ruled by a single party. Singapore’s People’s Action Party (PAP) remains dominant, though that appears to be changing. The others evolved into multi-party democracies during the middle-income transition. China, too, has now reached this critical last leg of the long march to advanced-country status in terms of economic structure and income levels.

Singapore should continue to be a role model for China, despite its smaller size. The success of both countries reflects many contributing factors, including a skilled and educated group of policymakers supplied by a meritocratic selection system, and a pragmatic, disciplined, experimental, and forward-looking approach to policy.

The other key lesson from Singapore is that single-party rule has retained popular legitimacy by delivering inclusive growth and equality of opportunity in a multi-ethnic society, and by eliminating corruption of all kinds, including cronyism and excessive influence for vested interests. What Singapore’s founder, Lee Kwan Yew, and his colleagues and successors understood is that the combination of single-party rule and corruption is toxic. If you want the benefits of the former, you cannot allow the latter.
Good corruption, bad corruption
Kate Mackenzie at FT Alphaville highlighted analysis by Andrew Wedeman on distinguishing between "good corruption" and "bad corruption" and how the two affect a country's growth path:
“Although there is no good corruption,” Wedeman writes, “there is clearly bad and worse corruption: the corruption that has negative effects, and the corruption that can have potentially catastrophic effects.” The science of kleptocracy separates the behavior into two basic types: “developmental corruption” of the kind we see in Korea and Taiwan, which does not ultimately prevent the economy from recovering, and “degenerative corruption” of the kind that ruined the economies in Zaire and Haiti.

In other words, "good corruption" involves insiders milking the economy because they see opportunity. They therefore re-invest their new wealth back into that economy, which would enhance growth potential. "Bad corruption", on the other hand, typically involves dictators and other insiders looting the economy and then sending their wealth abroad instead of re-investing the proceeds back into that economy. FT Alphaville also pointed to an article in the New Yorker by Evan Osnos that concluded that China has many elements of "bad corruption":
Investors, says Osnos, assume China resembles growth-friendly Korea and Taiwan, more than Zaire and Haiti. But Wedeman found that assumption is incorrect; China has the ‘worse’, or growth-unfriendly, type of corruption. As Wedeman told WSJ’s China RealTime:
China is different because the Communist Party does not depend on injections of cash from the private sector. As a result, whereas dirty money was an integral part of the developmental success in South Korea, Taiwan, and Japan, in China corruption fits the classic definition — the misuse of public authority for private gain.
In the long run, this type of corruption creates an incredible drag on an economy. It will eventually slow growth and the commodity supercycle will crash. In the short run, the composition of the current leadership suggests that it will continue to try to stimulate through more of the same, such as infrastructure projects, in order to boost growth. This will mean that commodity demand will continue - for now. At some point in the future, the global economy will turn down. When that happens, the Chinese economy will experience a crash landing, i.e. negative GDP growth, rather than the crash landing (sub-par GDP growth) that investors fear.


Watching the Vancouver residential property market
I am often asked about how to time a China slowdown. I am fortunate to be living here on the Canadian west coast in Vancouver where I have a bird's eye view of Asia and the Pacific Rim. In particular, I am monitoring the residential property market here in Vancouver (non-residents see Vancouver RE and then some), where we are seeing some of the "leakage" from China. The market has slowed considerably here (via The Economic Analyst):


Despite the slowdown, the market continues to be over-priced on an absolute basis (see this comparison from Vancouver Condo Info of what you get for $2.5 million).

As the Chinese economy stabilizes and its growth revives, I will be watching the Vancouver residential property market as a secondary indicator of China's economic health. This will have important implications the growth path of the global economy and for the commodity supercycle.


Cam Hui is a portfolio manager at Qwest Investment Fund Management Ltd. ("Qwest"). This article is prepared by Mr. Hui as an outside business activity. As such, Qwest does not review or approve materials presented herein. The opinions and any recommendations expressed in this blog are those of the author and do not reflect the opinions or recommendations of Qwest.


None of the information or opinions expressed in this blog constitutes a solicitation for the purchase or sale of any security or other instrument. Nothing in this article constitutes investment advice and any recommendations that may be contained herein have not been based upon a consideration of the investment objectives, financial situation or particular needs of any specific recipient. Any purchase or sale activity in any securities or other instrument should be based upon your own analysis and conclusions. Past performance is not indicative of future results. Either Qwest or Mr. Hui may hold or control long or short positions in the securities or instruments mentioned.

Monday, November 19, 2012

Waiting for a Santa Claus rally

In my post last week I noted a number of positive divergences in the FX market (see Waiting for the bounce) and thought that equities were poised for a bounce. Now I am seeing bullish divergences in the VIX Index as well, which suggest that the markets are poised for a more sustainable rally into December much like the traditional Santa Claus rally.

First, consider this chart of the VIX Index (top) and the SPX (bottom). The normal inverse relationship of these two indices appears to be broken. Stocks have been falling all of last week, so why is the VIX down on the week as well? Even if you were to ignore the lockstep downward movement of the VIX and SPX on Monday and Tuesday, the VIX was flat to slightly down from Tuesday's close to Friday (green line) while the stock market continued to fall for that period.


Is fear falling? If so, then is this a bullish divergence?


Volatility term structure forecasting a bullish reversal
In addition, I wrote an interesting post by Vance Harwood entitled Protecting High Yield Bond Investments with VIX/VXV Based Timing where he used the term structure of volatility for market timing (mostly in high yield bonds):
Recently I’ve been looking at volatility metrics for predicting market action. The CBOE’s VIX index gets a lot of attention, but using absolute values of the VIX to trigger investments is almost certainly useless. On the other hand, volatility prices over different time frames, often called the term structure, does show significant predictive value.

In a truly bearish market the short term expected volatility, typically cheaper than longer term volatility, climbs higher than the longer term value. This behavior is shared between flavors of VIX (e.g., the one month VIX and its three month version VXV), VIX futures, and the implied volatility of same strike options of different months...

A simple metric that captures this behavior divides the short term volatility number by a longer term number. If the ratio is below one the market is relatively calm, if above one the market is especially nervous. I’ve been using the CBOE’s VIX and VXV indexes as a convenient way to implement this volatility metric.
The same principles he uses can be applied to the stock market. In "normal" markets, short-term volatility (VIX) is slightly lower than longer dated volatility (e.g. three-month VXV). Harwood uses the VIX to VXV ratio as a way of measuring how much angst the market has about volatility. If one-month volatility (VIX) significantly rises above three-month volatility (VXV), then watch out below.

He uses a threshold of 0.917 for the VIX to VXV as his trigger point. If the ratio is below that number, then he will hold high yield bonds, but he will exit his position if the ratio rises above the threshold.

While the 0.917 threshold is a trigger that could be the result of data mining, I examined the history of ratio based on data I downloaded from CBOE and found the median ratio was 0.928. The difference between Harwood's 0.917 and the median is, as they say, close enough for government work. As a test, I added a further refinement. I created a second "crash warning" trigger, based on the median plus two standard deviations, which came to about 1.10.

The chart below shows the results of my backtest of a modified version of Harwood's model. First consider the lower panel showing the VIX to VXV ratio. I have defined a high-risk zone as ratio readings that are two standard deviations above the median and a caution zone as readings above the median of 0.928.


Buy signals are generated when the ratio descends from the caution zone below the median ratio reading, which are shown as blue arrows in the upper panel of the S+P 500. Sell signals occur when the ratio rises above the median (red arrows) and "crash warnings" are flashed when the ratio rises above two standard deviations above the median.

As you can see, the model seems to have backtested reasonably well and will bear watching to see how it performs in real-time. Buy signals have been relatively good entry points and sell signals have been good exit points to go to cash. Moreover, the two "crash warnings" have been excellent signals to enter into short positions.

With the caveat that this is only a backtest, I would highlight the back that the VIX to VXV indicator has fallen and generated a buy signal in the last week. Based on past experience, this suggests a sustained advance of several weeks for the stock market.


NYSE Summation Index turning up?
In addition, I have been watching the slow stochastic of the NYSE Summation Index, which is shown below in the top panel, with the SPX shown in the bottom panel. In the past, cross-overs in the stochastic have marked good entry points to get long the stock market and this indicator has only failed once out of six in the past two years.


In summary, the stock market has fallen hard in the last few weeks and is oversold. While oversold markets can get more oversold, this market is poised for a rally. Intermediate term indicators, such as the VIX Index, the term structure of volatility (which measure risk appetite) and breadth indicators (NYSE Summation Index) are pointing to a multi-week advance once a bottom is established.

Get ready for the Santa Claus rally.


Cam Hui is a portfolio manager at Qwest Investment Fund Management Ltd. ("Qwest"). This article is prepared by Mr. Hui as an outside business activity. As such, Qwest does not review or approve materials presented herein. The opinions and any recommendations expressed in this blog are those of the author and do not reflect the opinions or recommendations of Qwest.

None of the information or opinions expressed in this blog constitutes a solicitation for the purchase or sale of any security or other instrument. Nothing in this article constitutes investment advice and any recommendations that may be contained herein have not been based upon a consideration of the investment objectives, financial situation or particular needs of any specific recipient. Any purchase or sale activity in any securities or other instrument should be based upon your own analysis and conclusions. Past performance is not indicative of future results. Either Qwest or Mr. Hui may hold or control long or short positions in the securities or instruments mentioned.

Friday, November 16, 2012

A better way to play a China rebound

It should be obvious that China's economy has turned the corner. While we may not necessarily see gang buster growth, the risks of a hard landing are diminishing fast (see my previous posts China dodges a bullet? and Is the World Bank's downgrade of China's growth the nadir?).

The chart below of Chinese stocks (as represented by FXI) compared to the MSCI All-Country World Index (ACWI) shows that FXI rallied through a relative downtrend line in October, indicating that the worst is over for Chinese stocks. Moreover, FXI has retreated to test the downtrend line, which is now relative support, and this represents a good entry point for China bulls.


Given the volatility of Chinese stocks due to the uncertainty in political climate and weak corporate governance, a better way to play a rebound in Chinese growth may be through the markets of China's regional trading partners. The chart below of MSCI Pacific Ex-Japan (EPP) relative to ACWI shows that EPP is in a more robust relative uptrend. There is a short dated relative uptrend (dotted line) that began in October, which is supported by a longer dated relative uptrend (solid line) that began in May when EPP bottomed on a relative basis.


Another way is to play a China rebound is through Australian equities, such as EWA. A glance at top 10 stocks in EPP shows that nine of them are Australian, which indicates that the Aussie market has the heaviest influence in EPP.


Another way to get exposure is through the Hong Kong ETF (EWH). The chart of EWH vs. ACWI below shows that Hong Kong equities staged a relative breakout in late September and have been in a well=defined relative uptrend since. EWH does appear to be a tad overextended in the short-term, though.


One way to diversify your exposure is to buy both Australia and Hong Kong. The bottom panel of the above chart shows the correlation between EWA and EWH, which currently stands at 0.62. While that is an elevated reading, keep in mind that is roughly the long-term correlation between stocks and bonds and therefore positions in those two ETFs should provide an adequate level of diversification while maintaining an exposure to the China bull story.


Cam Hui is a portfolio manager at Qwest Investment Fund Management Ltd. ("Qwest"). This article is prepared by Mr. Hui as an outside business activity. As such, Qwest does not review or approve materials presented herein. The opinions and any recommendations expressed in this blog are those of the author and do not reflect the opinions or recommendations of Qwest.

None of the information or opinions expressed in this blog constitutes a solicitation for the purchase or sale of any security or other instrument. Nothing in this article constitutes investment advice and any recommendations that may be contained herein have not been based upon a consideration of the investment objectives, financial situation or particular needs of any specific recipient. Any purchase or sale activity in any securities or other instrument should be based upon your own analysis and conclusions. Past performance is not indicative of future results. Either Qwest or Mr. Hui may hold or control long or short positions in the securities or instruments mentioned.

Thursday, November 15, 2012

Watching for the bounce

In my last post on Monday morning (see Choppy markets ahead), I wrote that the markets were likely to rally this week:
[I]t may be premature to pile in on the short side. The market is oversold and it is poised for a bounce this week as option expiry weeks tend to have a positive bias and the SPX tests its 200-day moving average support.
I was clearly wrong. Nevertheless, as the equity markets continue to deflate they have become even more oversold. AAII bullish sentiment (via Bespoke) is falling fast.


A curious bullish divergence
While the bears are in control of the tape, I would reiterate the risks of getting short at these levels. A curious bullish divergence is appearing in the currency markets. While stocks have continued their bearish pattern of strength in the morning and fading for the rest of the day, risk-on currencies such as the euro (shown in red) and the Canadian Dollar (blue) are showing strength.


Similarly, commodity prices, which is another risk-on asset, have begun to steady.

While the bears appear to be in control of the tape right now, I would reiterate my caution to get short at current levels. If you want to get bearish, at least wait for the rally to enter your position.


Cam Hui is a portfolio manager at Qwest Investment Fund Management Ltd. ("Qwest"). This article is prepared by Mr. Hui as an outside business activity. As such, Qwest does not review or approve materials presented herein. The opinions and any recommendations expressed in this blog are those of the author and do not reflect the opinions or recommendations of Qwest.


None of the information or opinions expressed in this blog constitutes a solicitation for the purchase or sale of any security or other instrument. Nothing in this article constitutes investment advice and any recommendations that may be contained herein have not been based upon a consideration of the investment objectives, financial situation or particular needs of any specific recipient. Any purchase or sale activity in any securities or other instrument should be based upon your own analysis and conclusions. Past performance is not indicative of future results. Either Qwest or Mr. Hui may hold or control long or short positions in the securities or instruments mentioned.

Monday, November 12, 2012

Choppy markets ahead

Last Wednesday, I wrote the following before the market open because of the volatility and apparent lack of direction overnight (see What now for the markets?):

Here is what I am watching. The graph below of the relative performance of SPY, representing equities and the risk-on trade, against TLT, representing long Treasuries and the risk-off trade, is forming a wedge - a sign of indecision for technicians.


Technicians often describe this pattern as a coiled spring. When it breaks out, it will typically break hard in the direction of the break.
I was waiting for direction from this Risk on/Risk off metric to tell me which way the market it was going to break - and what a decision! Look at the updated chart now showing the bearish break:


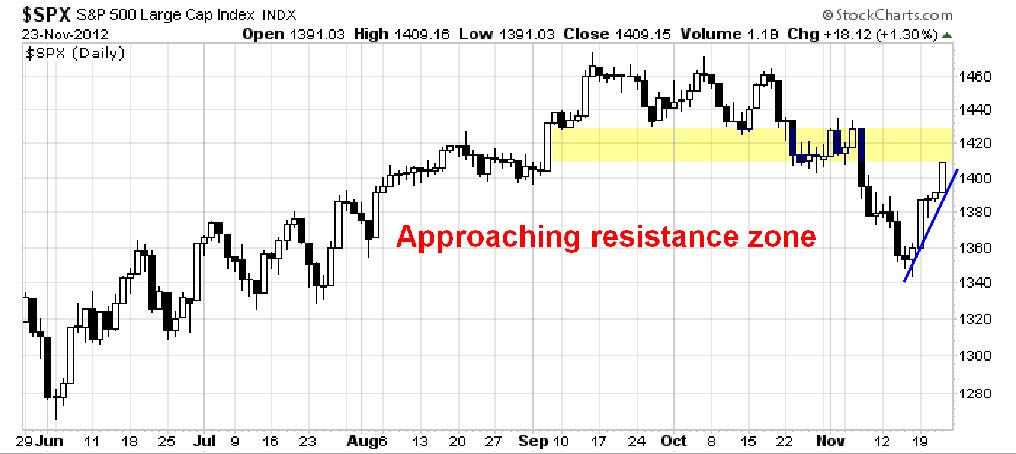
So risk-off it is, but it may be premature to pile in on the short side. The market is oversold and it is poised for a bounce this week as option expiry weeks tend to have a positive bias and the SPX tests its 200-day moving average support. Todd Salamone of Schaeffers Research wrote [emphasis added]:
The encouraging news for bulls is that the VIX has still not advanced above the level that is defined as 50% above its calendar year low (13.30 in August). This would suggest that volatility buyers view portfolio insurance as too expensive at current levels. In turn, this could have a calming effect on the broader market, as the mechanics of portfolio insurance purchases are a coincidental capping mechanism. In fact, a bullish unwinding of speculative downside bets or hedges against a decline is now a possibility, with expiration of index and ETF options this coming Friday and the high-demand VIX options set to expire on Nov. 21.
There are too many things that could still go right globally, which could spark a rally that could rip the face off any shorts.


The bear case
The bear case is easy to make under the circumstances. The morphine jolt from QE-infinity is wearing off and the patient needs ever increasing doses of QE to power the market higher. The fiscal cliff looms and the consequences are dire.

In Europe, the Greeks continue their brinkmanship games. There is disagreement within the Troika about what to do. The Europeans want another round of extend and pretend, but the IMF is skeptical that Greece can meet its targets. Tim Duy summarized the situation this way:
I understand this is considered political dynamite in Europe, but I still think it will be virtually impossible to fix Greece without a direct transfer of resources. A large, official debt forgiveness program. I suspect the alternative - a failed state on Europe's borders - will be more costly in the long-run.
What's more, the results and guidance from Earnings Season have been less than encouraging for the stock market. Josh Brown have turned more cautious on stocks because of the "earnings cliff":
First, let us discuss the Cliff that no one else seems to want to acknowledge - The Earnings Cliff! This is a very real phenomenon that is very dangerous for both stocks and the economy as a whole - corporations facing a deceleration in earnings growth or an outright drop in year-over-year profits DO NOT INCREASE SPENDING AND HIRING. They just don't. That is why earnings recessions make for a pretty good economic indicator, we can argue about whether it is a leading or a coincident indicator some other time.


And please keep in mind that earnings and interest rates are the only thing that matter in the weighing (not the voting) over the long term. So, I'll spot you that interest rates are on our side - fine. And then you'll say, "but Josh, we're coming off of a record year for S&P 500 earnings!" And I'll agree, but then I'll remind you that this is not such a great thing.
Add to the mix the rising fear of a recession due to weakening earnings, the bears are taking control of the market. This chart from Political Calculations tell the story of dividend cuts as a sign of a weakening earnings outlook:


Josh Brown's business partner Barry Ritholz thinks that the odds of a recession are rising:
In terms of future recession probabilities, I now place us at 60% over the next 18 months. In other words, we are more likely to see a normal cyclical recession before Spring 2014 than not.
BCA Research believes that the global credit cycle is turning down, which is one of the precursors to a global recession:


Fiscal cliff worries overblown
Despite last week's negative market tone, I think that it's too early to get overly bearish. I interpret these signals as indications to be more concerned and the stock market will go sideways, but in a highly choppy fashion.

There are still reasons to be bullish. Firstly, panic over the fiscal cliff is overblown. Consider this chart (via Business Insider) of the number of articles referring to the fiscal cliff, compared to past articles about the debt ceiling:


The most likely outcome is some compromise solution. Bruce Krasting speculated that we could see a kick the can down the road exercise:
Lots of policy options are measured in the chart. Think like a politician, and go to the bottom line. What set of proposals has the biggest bang? My summary from the CBO chart:

-Totally junk the scheduled spending cuts for the military.
-Do away with all of the mandatory non-defense cuts (sequestration).
-Don’t do anything with taxes. Roll over everything for a couple of more years.
-Extend the 2% payroll tax break for two years.
Such a decision would buy time for the American economy to grow out of its problems:
If we kick the can down the road for a few more years, what do we get? The deep thinkers have come up with numbers that look pretty attractive. The CBO thinks that significant benefits could be realized as soon as September 30, 2013.
In terms of jobs, the CBO reckons that as many as 3.4m jobs could be created/saved if everything on the cliff is pushed off to the future.

The economy would be much stronger if the can is kicked. The difference between falling off the cliff and extending everything is 2.9% of GDP. That’s a very big number; it comes to $500Bn of top-line growth.
A political solution to the fiscal cliff would spark the face-ripping rally if you get bearish and short.


An earnings cliff?
If we don't get a recession, what about an earnings recession that send stock prices down? I have written about the bifurcation in the US economy (see Time to take some risk off the table). Employment, consumer spending and housing have been headed up, but business confidence and capital spending are tanking. Could labor's share of the economic pie be coming back and the returns to capital shrink? If so, stock prices would react to a margin squeeze like that by falling. Brown and Ritholz referred to this as an earnings cliff.

Mike Boyle at AAM puts the earnings cliff into context and concluded that there is little to worry about:
Clearly, there have been some high-profile earnings misses this quarter, such as Google and Apple – and of course there is the fact that Google even mistakenly released their earnings report midway through the trading day on Oct 18 vice after the close of trading. Despite this, as we look at the numbers, we see a current earnings season that looks, at least statistically, very similar to the last and also compares very closely with long-term averages.


No signs of economic stress
I am no Pollyanna who believes that everything is fine and this is a buying opportunity. I just think that the bearish case is over-hyped and we are not going straight down from here. I am particularly concerned about the signals from the commodity markets. Despite China's apparent turnaround in growth, why are commodity prices turning down? The signal from this market tells me that global growth is slowing.


While I am concerned that a synchronized global recession may not too far off in the horizon and the indicators bear watching, it is far too early to panic and dive into the bunker. The stress indicators that I watch are still showing relatively benign readings. The St. Louis Fed's Stress Index are falling, which indicates falling stress:


The Chicago Fed's National Financial Conditions Index isn't telling me that I should panic either.


Watch these indicators. Should financial stress start to spike, then it will be time to get bearish.


A recipe for volatility
In conclusion, I believe that all these cross-currents are just a recipe for more volatility. While I am concerned about downside risks, investors also have to be aware of what could go right. While I differ with Barry Ritholz's call for a recession, we do agree about volatility:
I don’t imagine we go straight down from here; There will be sell offs and rallies, pre and post elections. There will be some data points that suggest things aren’t so bad, and then some that are awful. It is not a black and white situation. I do believe the low volatility we have seen may very well become a thing of the past, and the VIX is becoming a definitive Buy.
It's looks like the market is going to be choppy for a while.


Cam Hui is a portfolio manager at Qwest Investment Fund Management Ltd. ("Qwest"). This article is prepared by Mr. Hui as an outside business activity. As such, Qwest does not review or approve materials presented herein. The opinions and any recommendations expressed in this blog are those of the author and do not reflect the opinions or recommendations of Qwest.


None of the information or opinions expressed in this blog constitutes a solicitation for the purchase or sale of any security or other instrument. Nothing in this article constitutes investment advice and any recommendations that may be contained herein have not been based upon a consideration of the investment objectives, financial situation or particular needs of any specific recipient. Any purchase or sale activity in any securities or other instrument should be based upon your own analysis and conclusions. Past performance is not indicative of future results. Either Qwest or Mr. Hui may hold or control long or short positions in the securities or instruments mentioned.

Saturday, November 10, 2012

Buy RIMM/Sell NOK

In a recent meeting, a colleague who is a Blackberry fan remarked that the trade to put on is to buy RIMM and short AAPL, largely on the basis of positive buzz about the newest device, the Blackberry 10. At that point, I shuddered. Putting on such a trade has two implicit bets:
  1. Apple (AAPL) is losing its franchise and competitive edge
  2. RIMM's Blackberry 10 will be a big winner
While AAPL's stock price has been deflating lately, talk that it is losing its competitive edge may be premature. To double down and then bet on the Blackberry 10 is like putting your money down on a long-shot exacta at the track - a risky proposition.

To be sure, this pair trade has shown a positive reversal and it does show recent positive momentum in favor of RIMM. The pair has been in a long relative downtrend as AAPL has outperformed RIMM for over five years. If you were to look at this chart, how confident are you further upside?


A more risk controlled pair
I suggested to my colleague that a better risk-controlled pair trade would be to buy RIMM and sell NOK. Both are perceived to be failing brands among wireless device makers, though RIMM is exhibiting positive momentum.


The pair is in a relative uptrend in RIMM's favor and there is more potential upside.

Warning: This is not a high conviction idea for me, but if someone wanted to speculate on the Blackberry 10, this is probably a better and more risk-controlled way to make that bet.


Cam Hui is a portfolio manager at Qwest Investment Fund Management Ltd. ("Qwest"). This article is prepared by Mr. Hui as an outside business activity. As such, Qwest does not review or approve materials presented herein. The opinions and any recommendations expressed in this blog are those of the author and do not reflect the opinions or recommendations of Qwest.

None of the information or opinions expressed in this blog constitutes a solicitation for the purchase or sale of any security or other instrument. Nothing in this article constitutes investment advice and any recommendations that may be contained herein have not been based upon a consideration of the investment objectives, financial situation or particular needs of any specific recipient. Any purchase or sale activity in any securities or other instrument should be based upon your own analysis and conclusions. Past performance is not indicative of future results. Either Qwest or Mr. Hui may hold or control long or short positions in the securities or instruments mentioned.

Wednesday, November 7, 2012

What now for the markets?

The market has been on a wild ride overnight since the election. It seemed as if Mr. Market couldn't decide if another four years of the Obama Administration was good or bad. Initially, ES futures sold off hard as the polls closed and Obama gained ground on Romney. It then rallied soon after Obama was declared the victor and the  USD weakened against most currencies. Most Asian and European bourses rose overnight. As the markets are poised to open on Wednesday, ES futures are deeply in the red and the USD has regained a bid.

Here is what I am watching. The graph below of the relative performance of SPY, representing equities and the risk-on trade, against TLT, representing long Treasuries and the risk-off trade, is forming a wedge - a sign of indecision for technicians.


Technicians often describe this pattern as a coiled spring. When it breaks out, it will typically break hard in the direction of the break.

Watch and listen to the message of the market.


Cam Hui is a portfolio manager at Qwest Investment Fund Management Ltd. ("Qwest"). This article is prepared by Mr. Hui as an outside business activity. As such, Qwest does not review or approve materials presented herein. The opinions and any recommendations expressed in this blog are those of the author and do not reflect the opinions or recommendations of Qwest.

None of the information or opinions expressed in this blog constitutes a solicitation for the purchase or sale of any security or other instrument. Nothing in this article constitutes investment advice and any recommendations that may be contained herein have not been based upon a consideration of the investment objectives, financial situation or particular needs of any specific recipient. Any purchase or sale activity in any securities or other instrument should be based upon your own analysis and conclusions. Past performance is not indicative of future results. Either Qwest or Mr. Hui may hold or control long or short positions in the securities or instruments mentioned.  

Tuesday, November 6, 2012

Electoral and market expectations

Ezra Klein has an (unscientific) sample of pundits with their views of the electoral outcome for the Presidential election and there are 11 calls for an Obama victory and 8 calls for a Romney victory. My favorite forecaster is intrade.

Notwithstanding the argument that polls are where people voice their opinions and prediction markets are where people put their money on the line, I was convinced of the prediction markets when in 1980, the polls showed a neck-and-neck race between Reagan and Carter, while the betting books in London showed about a two-thirds chance of a Reagan win. The rest is history.

As I write this, intrade is showing a 73.5% chance of four more years for Obama:


...and the key swing states breaking for Obama. If Romney can't even hold VA, then he is truly toast:


Here is my thought of the day. With opinions so divided and assuming that intrade forecast is correct, how badly will the markets be "surprised" by an Obama win?


Cam Hui is a portfolio manager at Qwest Investment Fund Management Ltd. ("Qwest"). This article is prepared by Mr. Hui as an outside business activity. As such, Qwest does not review or approve materials presented herein. The opinions and any recommendations expressed in this blog are those of the author and do not reflect the opinions or recommendations of Qwest.


None of the information or opinions expressed in this blog constitutes a solicitation for the purchase or sale of any security or other instrument. Nothing in this article constitutes investment advice and any recommendations that may be contained herein have not been based upon a consideration of the investment objectives, financial situation or particular needs of any specific recipient. Any purchase or sale activity in any securities or other instrument should be based upon your own analysis and conclusions. Past performance is not indicative of future results. Either Qwest or Mr. Hui may hold or control long or short positions in the securities or instruments mentioned.

A cautionary tale for quants and HFT designers

This blog has always been an advocate of using human intelligence as oversight over quantitative investment systems. In particular, I have been concerned about the takeover of trading the HFT robots.

On this day that America decides who gets to have his finger on the nuclear button for next four years, consider this story (from Business Insider) about how close we came to disaster in 1995:
In the 67 years since the detonation of the world's first nuclear weapon there is only one time the so-called nuclear briefcases were broken out and opened up. On January 25, 1995 they not only opened, they nearly launched Russia's nuclear arsenal at the United States.
As the story goes, the Soviets mis-interpreted the launch of a Norwegian test rocket as an ICBM attack:
When Norwegian Kolbjørn Adolfsen gave the nod to send a Black Brant rocket from the Andøya Rocket Range off the northwest coast of Norway to study the aurora borealis, he wasn't concerned at all.

Sure the Brant is a large, four-stage rocket that would fly to 930 miles above the earth near Russia, but he'd contacted the proper Kremlin authorities and hadn't given the flight a second thought.

What Adolfsen didn't know when he left the rocket base shortly after the missile was launched, is that the Brant's radar signature looks just like a U.S. sub-launched Trident missile.
Uh-oh...
The radar operators at Russia's Olenegorsk early warning station promptly reported the incoming missile to their superiors, but not a soul on duty within the military had been notified of Adolfsen's plans.

The officers at Olenegork believed it could be the first leg of a U.S. nuclear attack.

Four years after the Berlin Wall came down and Russia was in the throes of change, stable systems had been demolished and replacements had yet to fall into place. One thing that had gotten only more developed since 1991, however, was the Kremlin's mistrust of the United States.

So as the Brant streaked its way near Russian airspace, military officers had to decide if this was an electro-magnetic pulse attack that would disable their radar and allow for a full on American attack, and what they should do about it.

The matter was decided when the Brant separated, dropped one of its engines, and fired up another. The radar signature now looked so much like a multiple re-entry vehicle (MRV), a missile carrying multiple nuclear warheads, that military officers no longer had any doubt.
Time was getting short to respond:

There were now five minutes during which the missile's trajectory would be un-tracked by Russian radar, and when it could strike Moscow; a slice of time that was devoted to deciding whether to launch a counterattack.
Fortunately, the Soviets didn't have a hair trigger launch on warning policy, but actually had adults in charge:
Boris Yeltsin was alerted, and immediately given the Cheget, the "nuclear briefcase" that connects senior officials while they decide whether or not to launch Russia's nuclear weapons. Nuclear submarine commanders were ordered to full battle alert and told to stand by.

Apparently Yeltsin doubted the U.S. would launch a surreptitious attack and within five minutes, Russian radar came back confirming the missile was heading harmlessly out to sea.
Now consider what might have happened if algorithms were in charge? The missile signature looked like it was carrying a multiple warhead. What if the algos had decided that it was a hostile launch. What would it have done?

This a cautionary tale for HFT algo designers, who claim that their systems have numerous safeguards. Safeguards can and do fail. We found how an unexpected perturbation during the flash crash created enormous systemic problems. Fortunately, the only thing that people lost during the flash crash was money.

If algos had been in charge of the Soviet defense system in 1995, we all could have lost our lives.


Cam Hui is a portfolio manager at Qwest Investment Fund Management Ltd. ("Qwest"). This article is prepared by Mr. Hui as an outside business activity. As such, Qwest does not review or approve materials presented herein. The opinions and any recommendations expressed in this blog are those of the author and do not reflect the opinions or recommendations of Qwest.

None of the information or opinions expressed in this blog constitutes a solicitation for the purchase or sale of any security or other instrument. Nothing in this article constitutes investment advice and any recommendations that may be contained herein have not been based upon a consideration of the investment objectives, financial situation or particular needs of any specific recipient. Any purchase or sale activity in any securities or other instrument should be based upon your own analysis and conclusions. Past performance is not indicative of future results. Either Qwest or Mr. Hui may hold or control long or short positions in the securities or instruments mentioned.

Monday, November 5, 2012

What next for US homebuilders?

Several weeks ago, I identified the homebuilding stocks as a possible leadership candidate out of several (see Suggestions for bulls and bears). For once, it seems that I was ahead of the curve instead of behind the curve in my market calls as Warren Buffett announced last week that Berkshire Hathaway was getting into the business of being realtors. This represents an enormous vote of confidence for the housing sector in America, as per this story from Bloomberg:
Warren Buffett’s Berkshire Hathaway Inc. (BRK/A) is extending its bet on the U.S. housing market by forming a venture with Brookfield Asset Management Inc. (BAM/A) as low interest rates, inventory and prices spur a real-estate rebound.
Berkshire’s HomeServices of America Inc. unit will be the majority owner of the venture to manage a U.S. residential real- estate affiliate network, according to a statement on the new company’s website. The firms plan to offer a new franchise brand, Berkshire Hathaway Home Services, starting next year. Brookfield’s network has operated under the Prudential Real Estate and Real Living Real Estate brands.
Positive demographics = More demand
The demographic tea leaves are also lining up bullishly for housing. Walter Kurtz highlighted a report from Moody's indicating that housing demand is about to turn up as the Echo Boomers reach the age where they want more housing as they begin families:
It is a well known fact that homeownership in the US has been on a decline, a trend that started even before the financial crisis. Now Moody’s predicts this trend will begin reversing next year.


Their explanation has to do with demographics. Baby boomers are moving into the highest homeownership group by age, while “echo boomers” (children of baby boomers) are getting to the age at which they are significantly more likely to own a home than the younger age group.

Rising construction employment
What's more, last Friday's NFP report showed that the construction sector showed healthy employment gains. Despite being only 4.1% of the workforce, the sector showed 9.1% of the gains of 171K jobs.


On a longer term perspective, however, construction employment is still relatively flat and has potential to go quite a bit higher especially when I looked at this graph from Ed Yardeni:

Should construction continue to recover, then it would indeed be good news for the US economy and has the potential to feed through into a virtuous cycle of better employment and higher consumer spending.


What's next?
So what's next for the investors in homebuilding stocks?

In the short term, there could be some turbulence. Despite what some of the polls say, the latest figures from intrade.com shows Obama solidly in the lead for the big showdown on Tuesday. If Obama were to win re-election, which is my base case scenario, then you can expect that capital gains tax rates will rise. In response, expect investors to harvest their capital gains this year instead of waiting to take them next year and get hit with a higher tax bill.

What stocks have had the most gains this year? You guessed it, it's the homebuilders. Therefore, in the near term, don't be surprised to see some softness in these stocks as investors take their capital gains in 2012.
Longer term, the technical picture looks promising. The relative performance chart below of XHB against SPY shows that the homebuilding ETF to be in a well-defined relative uptrend (red channel) but testing a relative resistance level that dates back to 2007. A breakout out of such a long base suggest a technical target that is well above the relative highs set before the Lehman Crisis of 2007. Should tax-related profit taking occur, don't be surprised if these stocks pull back and test the bottom of the relative uptrend.


Bottom line: Short-term cautious, but long-term bullish on the sector. Expect some weakness until year-end, but any weakness could be a great opportunity to buy.


Cam Hui is a portfolio manager at Qwest Investment Fund Management Ltd. ("Qwest"). This article is prepared by Mr. Hui as an outside business activity. As such, Qwest does not review or approve materials presented herein. The opinions and any recommendations expressed in this blog are those of the author and do not reflect the opinions or recommendations of Qwest.   None of the information or opinions expressed in this blog constitutes a solicitation for the purchase or sale of any security or other instrument. Nothing in this article constitutes investment advice and any recommendations that may be contained herein have not been based upon a consideration of the investment objectives, financial situation or particular needs of any specific recipient. Any purchase or sale activity in any securities or other instrument should be based upon your own analysis and conclusions. Past performance is not indicative of future results. Either Qwest or Mr. Hui may hold or control long or short positions in the securities or instruments mentioned.